1. The Tenerife Vacation-Rental Market
Tenerife's vacation-rental market changed noticeably during the first eight months of 2026. Official ISTAC data shows a lower level of available vacation homes than in 2025, while average daily prices and average stays varied substantially by month.
For August 2026, ISTAC recorded 16,597 available vacation homes in Tenerife, a 14.6% year-on-year reduction. The island's reserved-home rate was 94.26%, the average daily price was €142.48, and average stay was 6.10 days.
For August 2025, Tenerife had 19,422 available homes, a 94.52% reserved-home rate, an average daily price of €153.70 and an average stay of 4.70 days.
2. Sayzora Hospitality: August 2025 vs August 2026
The Sayzora portfolio also changed between the two August periods. To make the occupancy comparison less sensitive to changes in portfolio size, Sayzora uses an operational-capacity methodology: a property enters the capacity calculation in the first month in which it records booked nights.
| August indicator | 2025 | 2026 | Change |
|---|---|---|---|
| Operational-capacity occupancy | 67.00% | 69.18% | +2.18 pp |
| ADR | €134.10 | €125.95 | −6.08% |
| Revenue per stay | Not published | Not published | +4.78% |
| Implied average stay | 7.38 nights | 8.23 nights | +11.55% |
Sayzora's August occupancy increased by 2.18 percentage points under the operational-capacity methodology. At the same time, ADR declined by 6.08%, while the implied average stay increased by 11.55%.
In other words, the August 2026 portfolio produced a different mix of price and stay duration than in August 2025: a lower nightly rate was accompanied by longer stays.
3. Average Daily Price: Market and Portfolio Moved in the Same Direction
ISTAC's Tenerife ADR declined from €153.70 in August 2025 to €142.48 in August 2026, a 7.30% reduction. Sayzora ADR declined by 6.08% over the same August comparison.
| August | Sayzora ADR | ISTAC Tenerife ADR |
|---|---|---|
| 2025 | €134.10 | €153.70 |
| 2026 | €125.95 | €142.48 |
| Year-on-year change | −6.08% | −7.30% |
The direction was therefore similar in both datasets. The levels are not expected to be identical because ISTAC represents the Tenerife market, while Sayzora represents a specific portfolio.
4. Longer Stays in 2026
Average stay is another important part of the picture. ISTAC reported an average Tenerife stay of 6.10 days in August 2026, up from 4.70 days in August 2025 — an increase of approximately 29.8%.
For Sayzora, the implied average stay rose from 7.38 nights to 8.23 nights, an increase of 11.55%.
| August indicator | 2025 | 2026 | Change |
|---|---|---|---|
| Sayzora implied average stay | 7.38 nights | 8.23 nights | +11.55% |
| ISTAC Tenerife average stay | 4.70 days | 6.10 days | +29.8% |
These figures are not calculated from identical populations or methodologies, so they should not be treated as directly interchangeable. They do, however, point to a common directional feature of the 2026 market: longer stays became more visible than in August 2025.
5. Sayzora Occupancy: January–August 2026
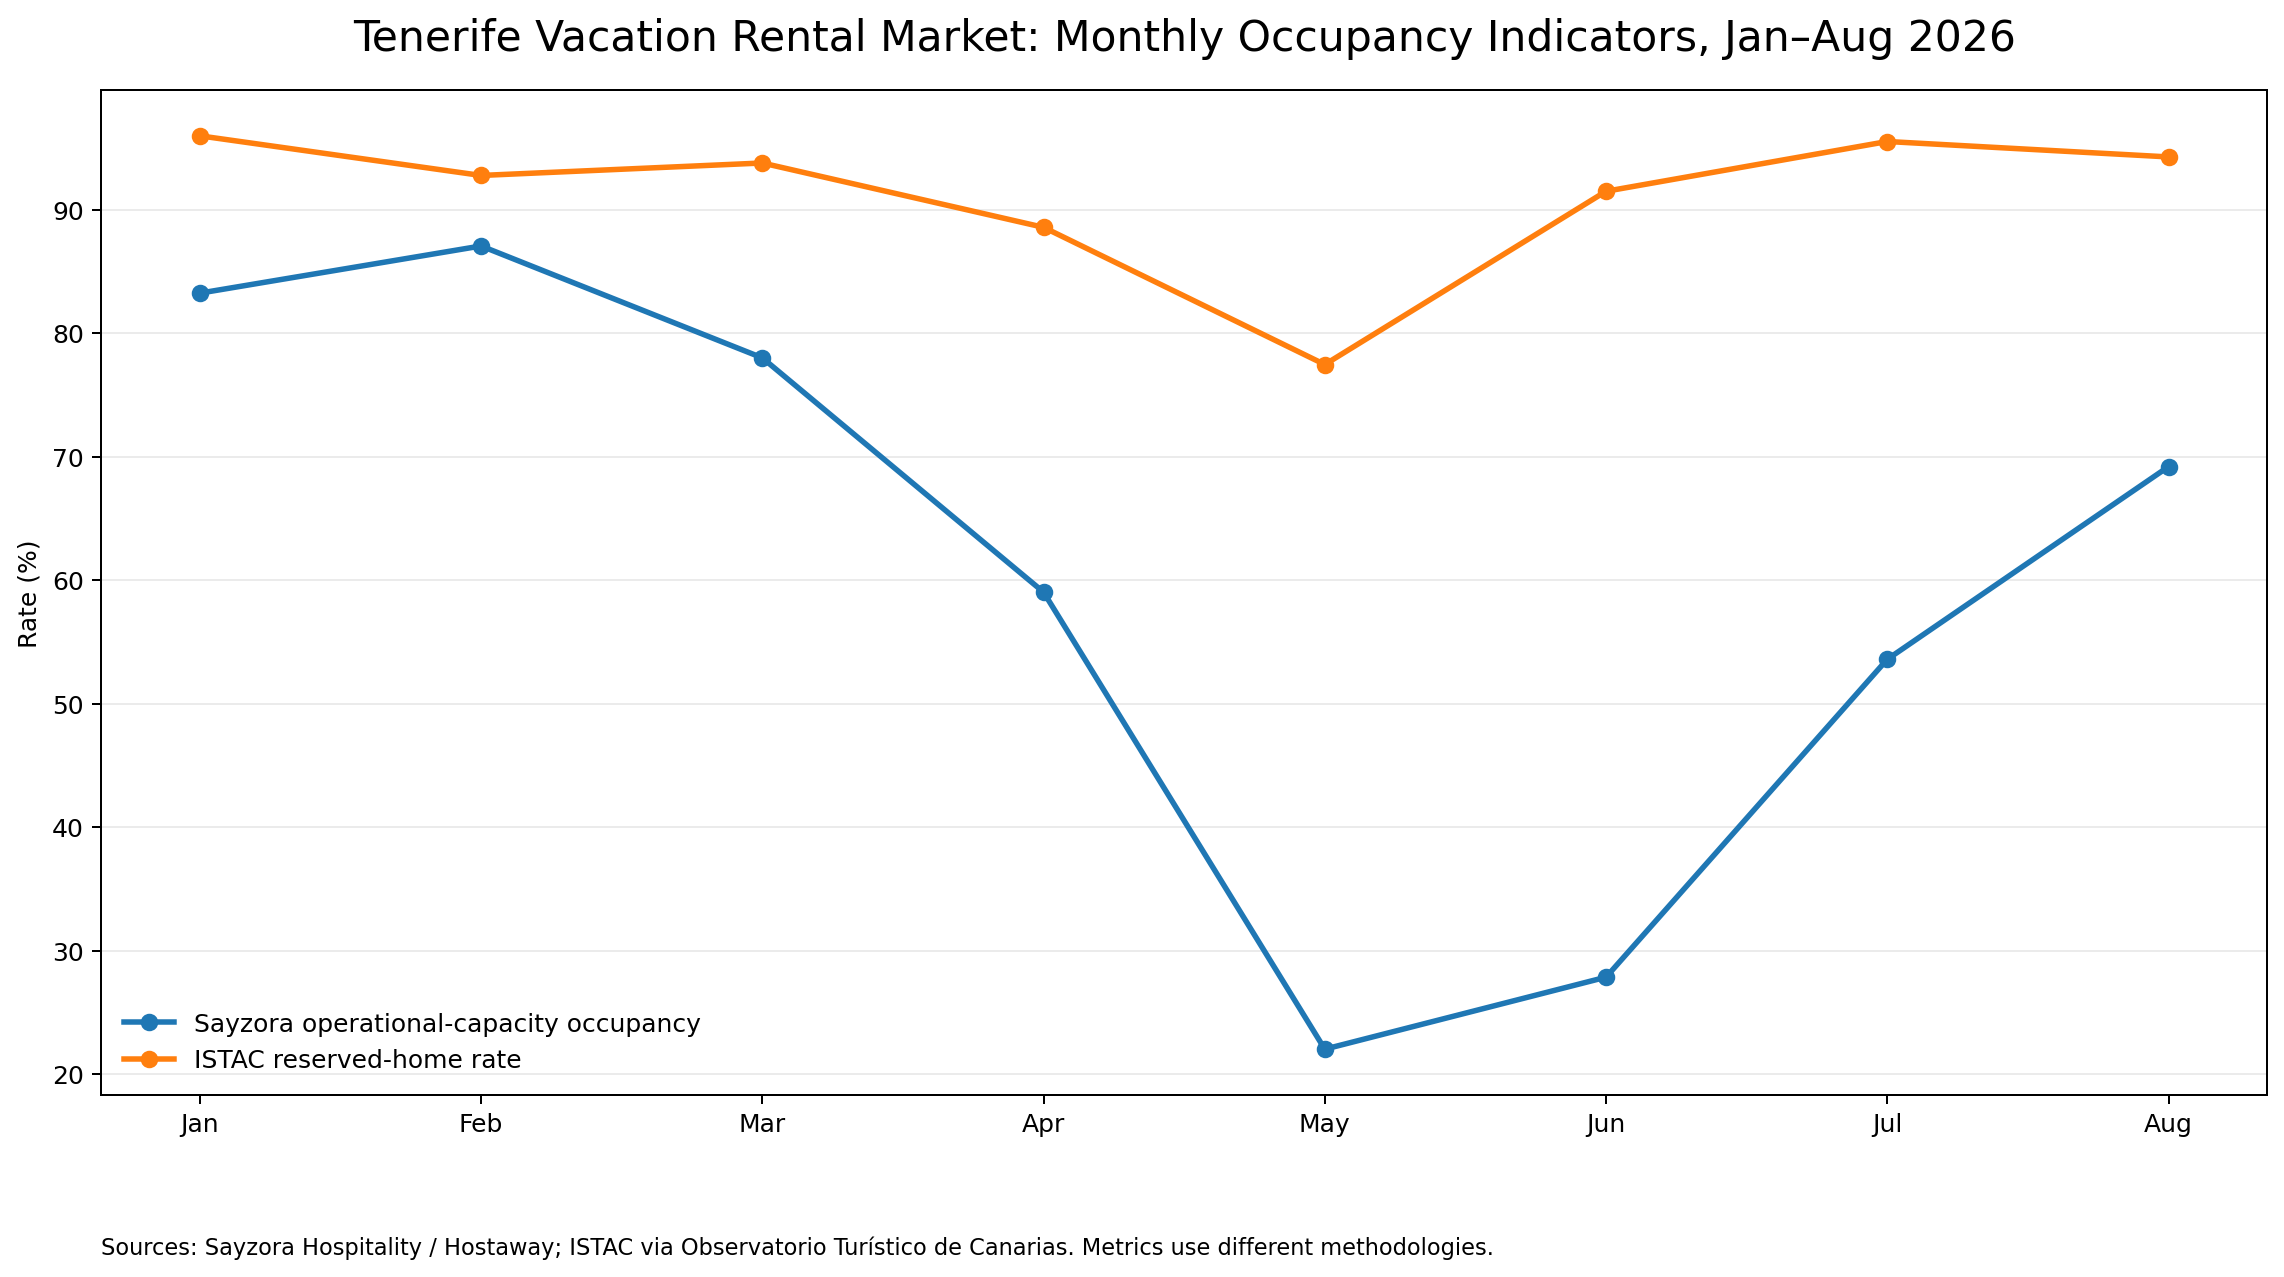
The monthly portfolio data shows a pronounced seasonal pattern. Sayzora's operational-capacity occupancy was strongest in January and February, declined through spring, and recovered in July and August.
| Period | 2025 | 2026 | Change |
|---|---|---|---|
| H1 operational-capacity occupancy | 67.72% | 58.49% | −9.23 pp |
| July | 58.31% | 53.58% | −4.73 pp |
| August | 67.00% | 69.18% | +2.18 pp |
The H1 comparison is intentionally based on operational capacity rather than simply comparing raw booked-night totals. Sayzora's portfolio changed during the period, so a capacity-adjusted view gives more useful context.
6. What the Data Tells Us
Several patterns stand out from the combined portfolio and market data.
- Market supply was lower: Tenerife had 16,597 available vacation homes in August 2026 versus 19,422 one year earlier.
- ADR was lower: both the Tenerife market and Sayzora portfolio recorded lower August ADR than in 2025.
- Stays were longer: both datasets show a higher average-stay indicator in August 2026, although the underlying methodologies differ.
- Sayzora occupancy recovered by late summer: August 2026 was 69.18% under the operational-capacity methodology, 2.18 percentage points above August 2025.
7. Why Average Indicators Matter
Looking only at occupancy can miss an important part of portfolio performance. A property portfolio can have a lower nightly rate but longer stays, or a higher nightly rate with shorter bookings.
For this reason, the Sayzora analysis considers three complementary indicators: occupancy, ADR and implied average stay. Together they provide more context than any one number alone.
8. A Note About Comparing Market and Company Data
ISTAC's tasa de vivienda reservada is a different market indicator. It should therefore be presented as contextual market data rather than as a direct equivalent of Sayzora occupancy.
Similarly, Sayzora's average stay in this article is implied, calculated as Average Revenue per Stay divided by ADR. Hostaway documents Average Revenue per Stay as total revenue divided by bookings within the selected period.
9. Conclusion
The first eight months of 2026 show a Tenerife vacation-rental market with lower available supply, lower average daily pricing and longer stays than in August 2025.
Within Sayzora's portfolio, the year was more seasonal: strong occupancy at the beginning of the year, a softer spring, and a recovery in July and August. In August, the portfolio combined a 69.18% operational-capacity occupancy with a €125.95 ADR and an implied average stay of 8.23 nights.
The data therefore supports a more nuanced view of 2026. Market conditions and portfolio performance should be read together, using occupancy, pricing and length of stay rather than relying on a single headline indicator.
Data Sources and Methodology
Sayzora Hospitality / Hostaway: portfolio occupancy, ADR and Average Revenue per Stay for the relevant periods.
Official ISTAC August 2025 report — Promotur_Indicadores VV agosto 2025 (PDF): View the official report.
Official ISTAC August 2026 report — Promotur_Indicadores VV agosto 2026 (PDF): View the official report.
ISTAC / Observatorio Turístico de Canarias: Tenerife vacation-home supply, reserved-home rate, ADR and average stay. The August 2026 data sheet was published by the Observatorio on 18 September 2026 and identifies ISTAC's Encuesta de Alojamiento Turístico as the source.
Operational-capacity methodology: for Sayzora occupancy comparisons, a property enters the operational capacity calculation in the first month in which it records booked nights. No portfolio property count is published in this article.
Confidentiality: absolute Sayzora revenue values are intentionally not published. Revenue-related changes are discussed only through percentage changes or derived indicators where appropriate.
Data & Market Analysis Team
Tenerife, Canary Islands