1. Executive Summary
The 2026 performance of the Sayzora portfolio shows a clear change in the pattern of occupancy compared with 2025. Occupancy was stronger in January and February 2026, but the portfolio moved below the previous year from March onward, with the largest year-on-year gap occurring in June.
This change coincided with a period of disruption in European aviation: jet-fuel prices rose sharply in March and April, European flight growth slowed, airlines adjusted capacity, and passenger traffic at Tenerife South Airport was below the previous year during the spring and summer months.
2. Sayzora Occupancy: 2025 vs 2026
To reduce the effect of normal seasonality, the comparison uses the same months in 2025 and 2026. Sayzora's occupancy is calculated using the operational-capacity methodology: a property enters the capacity calculation from the first month in which it records booked nights. This avoids treating historical Hostaway availability for a property that was not yet operational as real capacity.
| Month | 2025 | 2026 | Change |
|---|---|---|---|
| Jan | 74.84% | 83.23% | +8.39 pp |
| Feb | 85.00% | 87.05% | +2.05 pp |
| Mar | 82.58% | 77.99% | -4.59 pp |
| Apr | 75.67% | 59.02% | -16.65 pp |
| May | 35.78% | 22.01% | -13.77 pp |
| Jun | 58.18% | 27.84% | -30.34 pp |
| Jul | 58.31% | 53.58% | -4.73 pp |
| Aug | 67.00% | 69.18% | +2.18 pp |
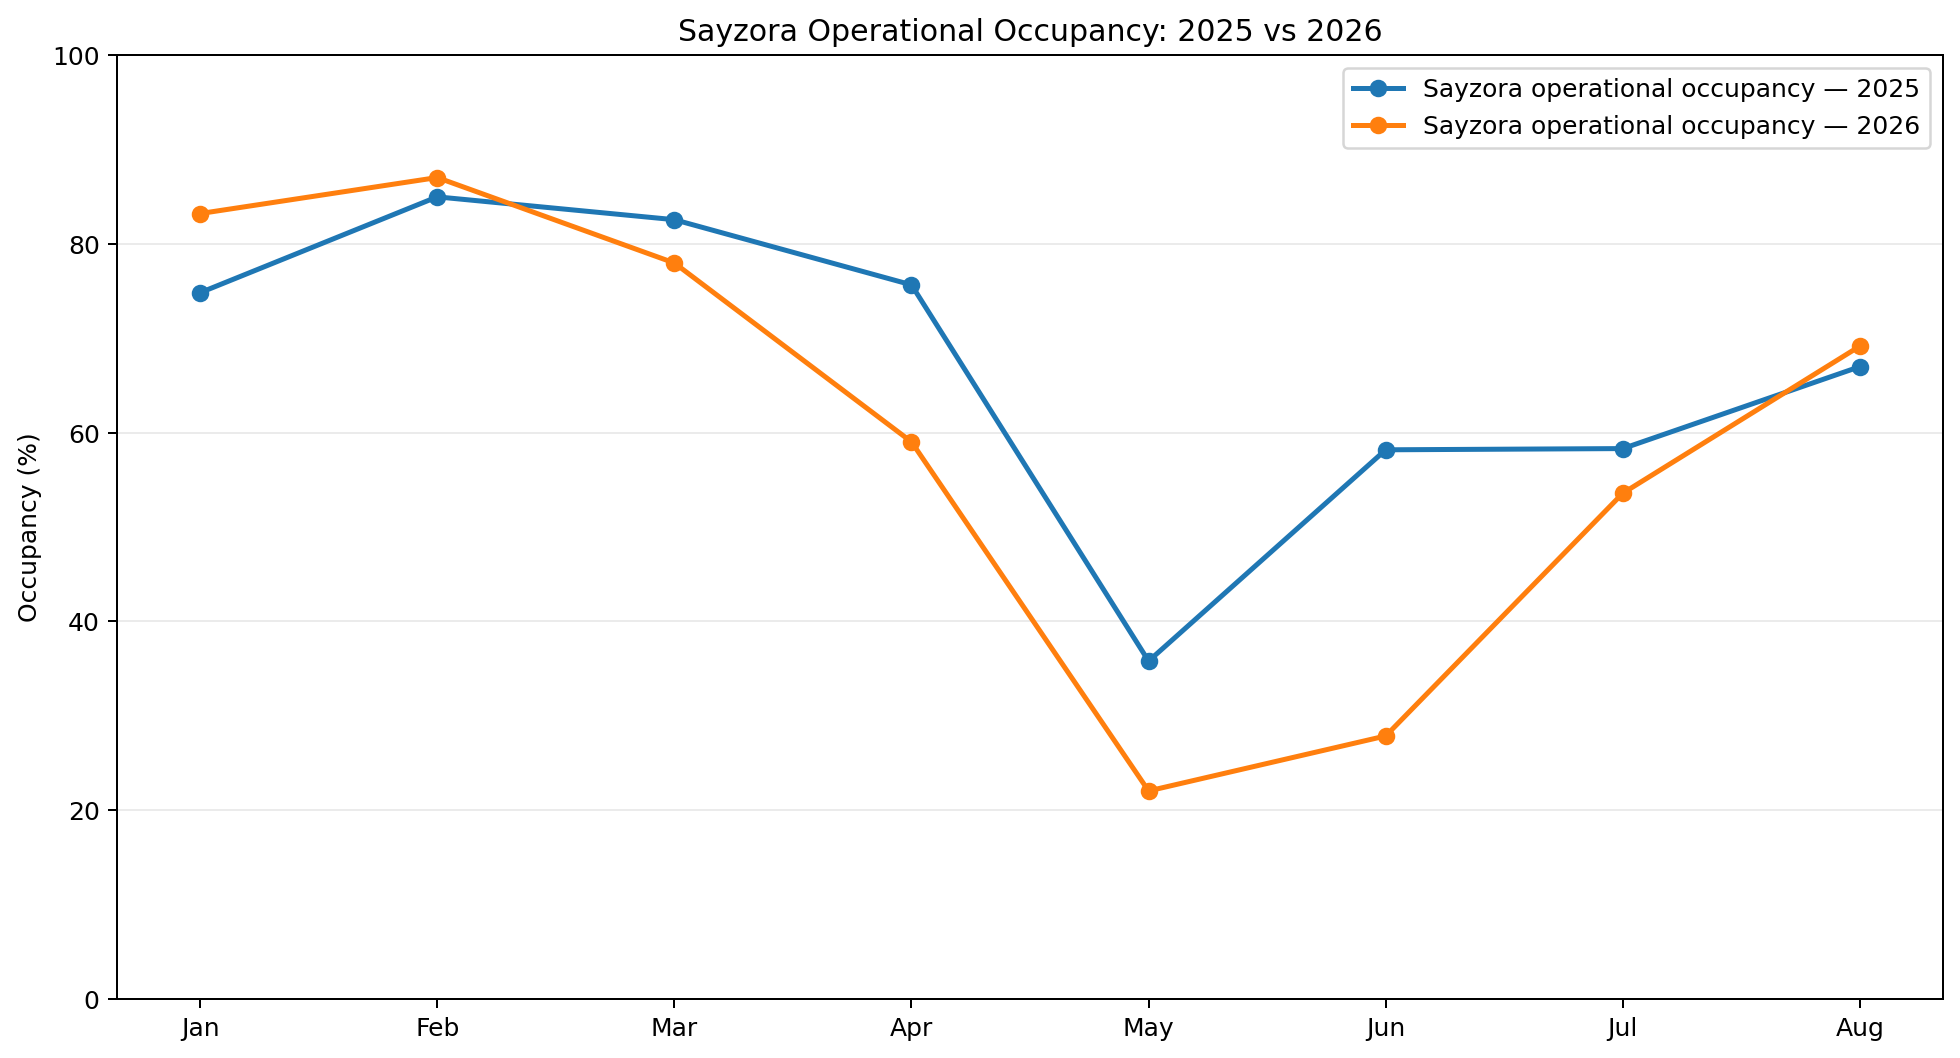
The largest deterioration occurred in June, when occupancy was 27.84% in 2026 compared with 58.18% in 2025, a difference of 30.34 percentage points. The gap narrowed to 4.73 percentage points in July, and August 2026 was 2.18 percentage points above August 2025.
3. Tenerife Market Context: ISTAC
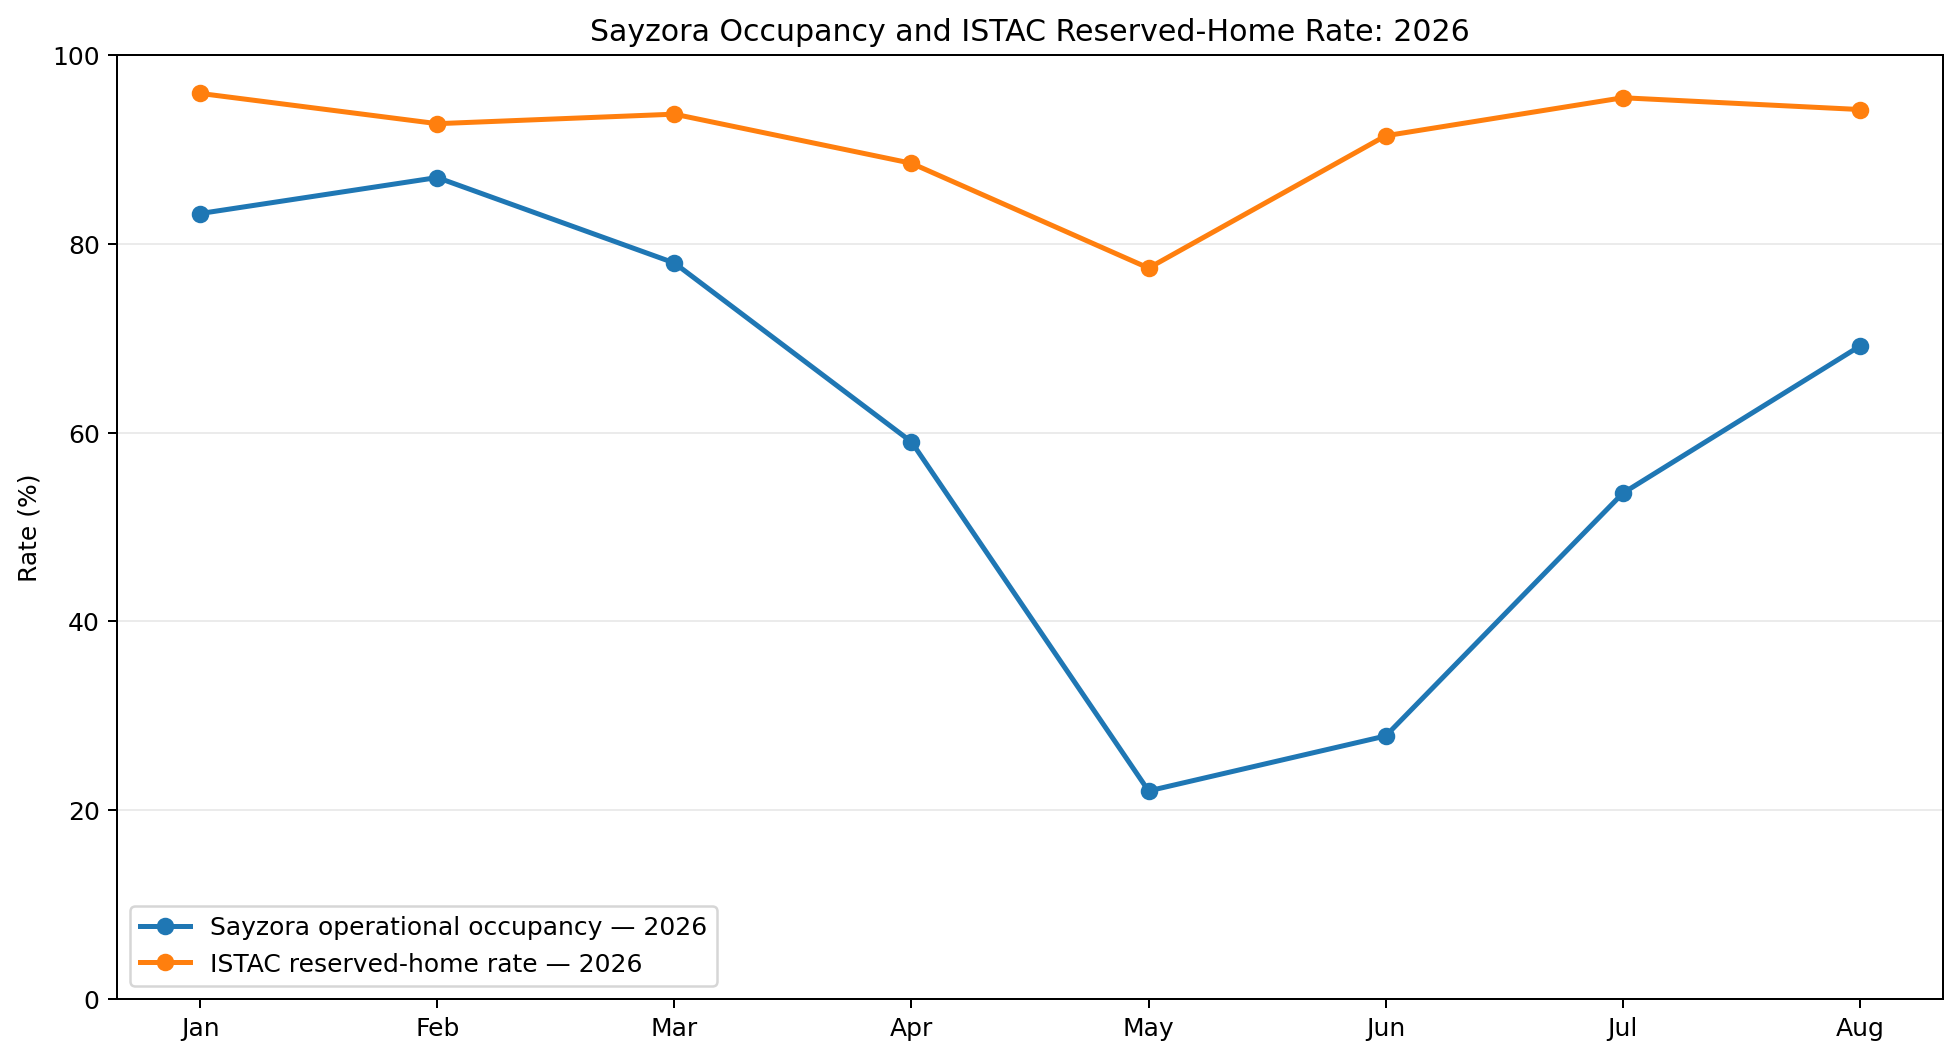
Official ISTAC data provides an independent market reference. Its reserved-home rate is not the same metric as Sayzora operational occupancy, so it should be interpreted as contextual market data rather than as a direct equivalent.
| August indicator | 2025 | 2026 | Change |
|---|---|---|---|
| Sayzora operational occupancy | 67.00% | 69.18% | +2.18 pp |
| Sayzora ADR | €134.10 | €125.95 | −6.08% |
| ISTAC reserved-home rate | 94.52% | 94.26% | −0.26 pp |
| ISTAC ADR | €153.70 | €142.48 | −7.30% |
| ISTAC average stay | 4.70 days | 6.10 days | +29.8% |
4. Aviation Costs and Tenerife South Passenger Traffic
The spring deterioration in Sayzora occupancy coincided with an exceptional shock to European aviation costs and a reduction in passenger traffic at Tenerife South.
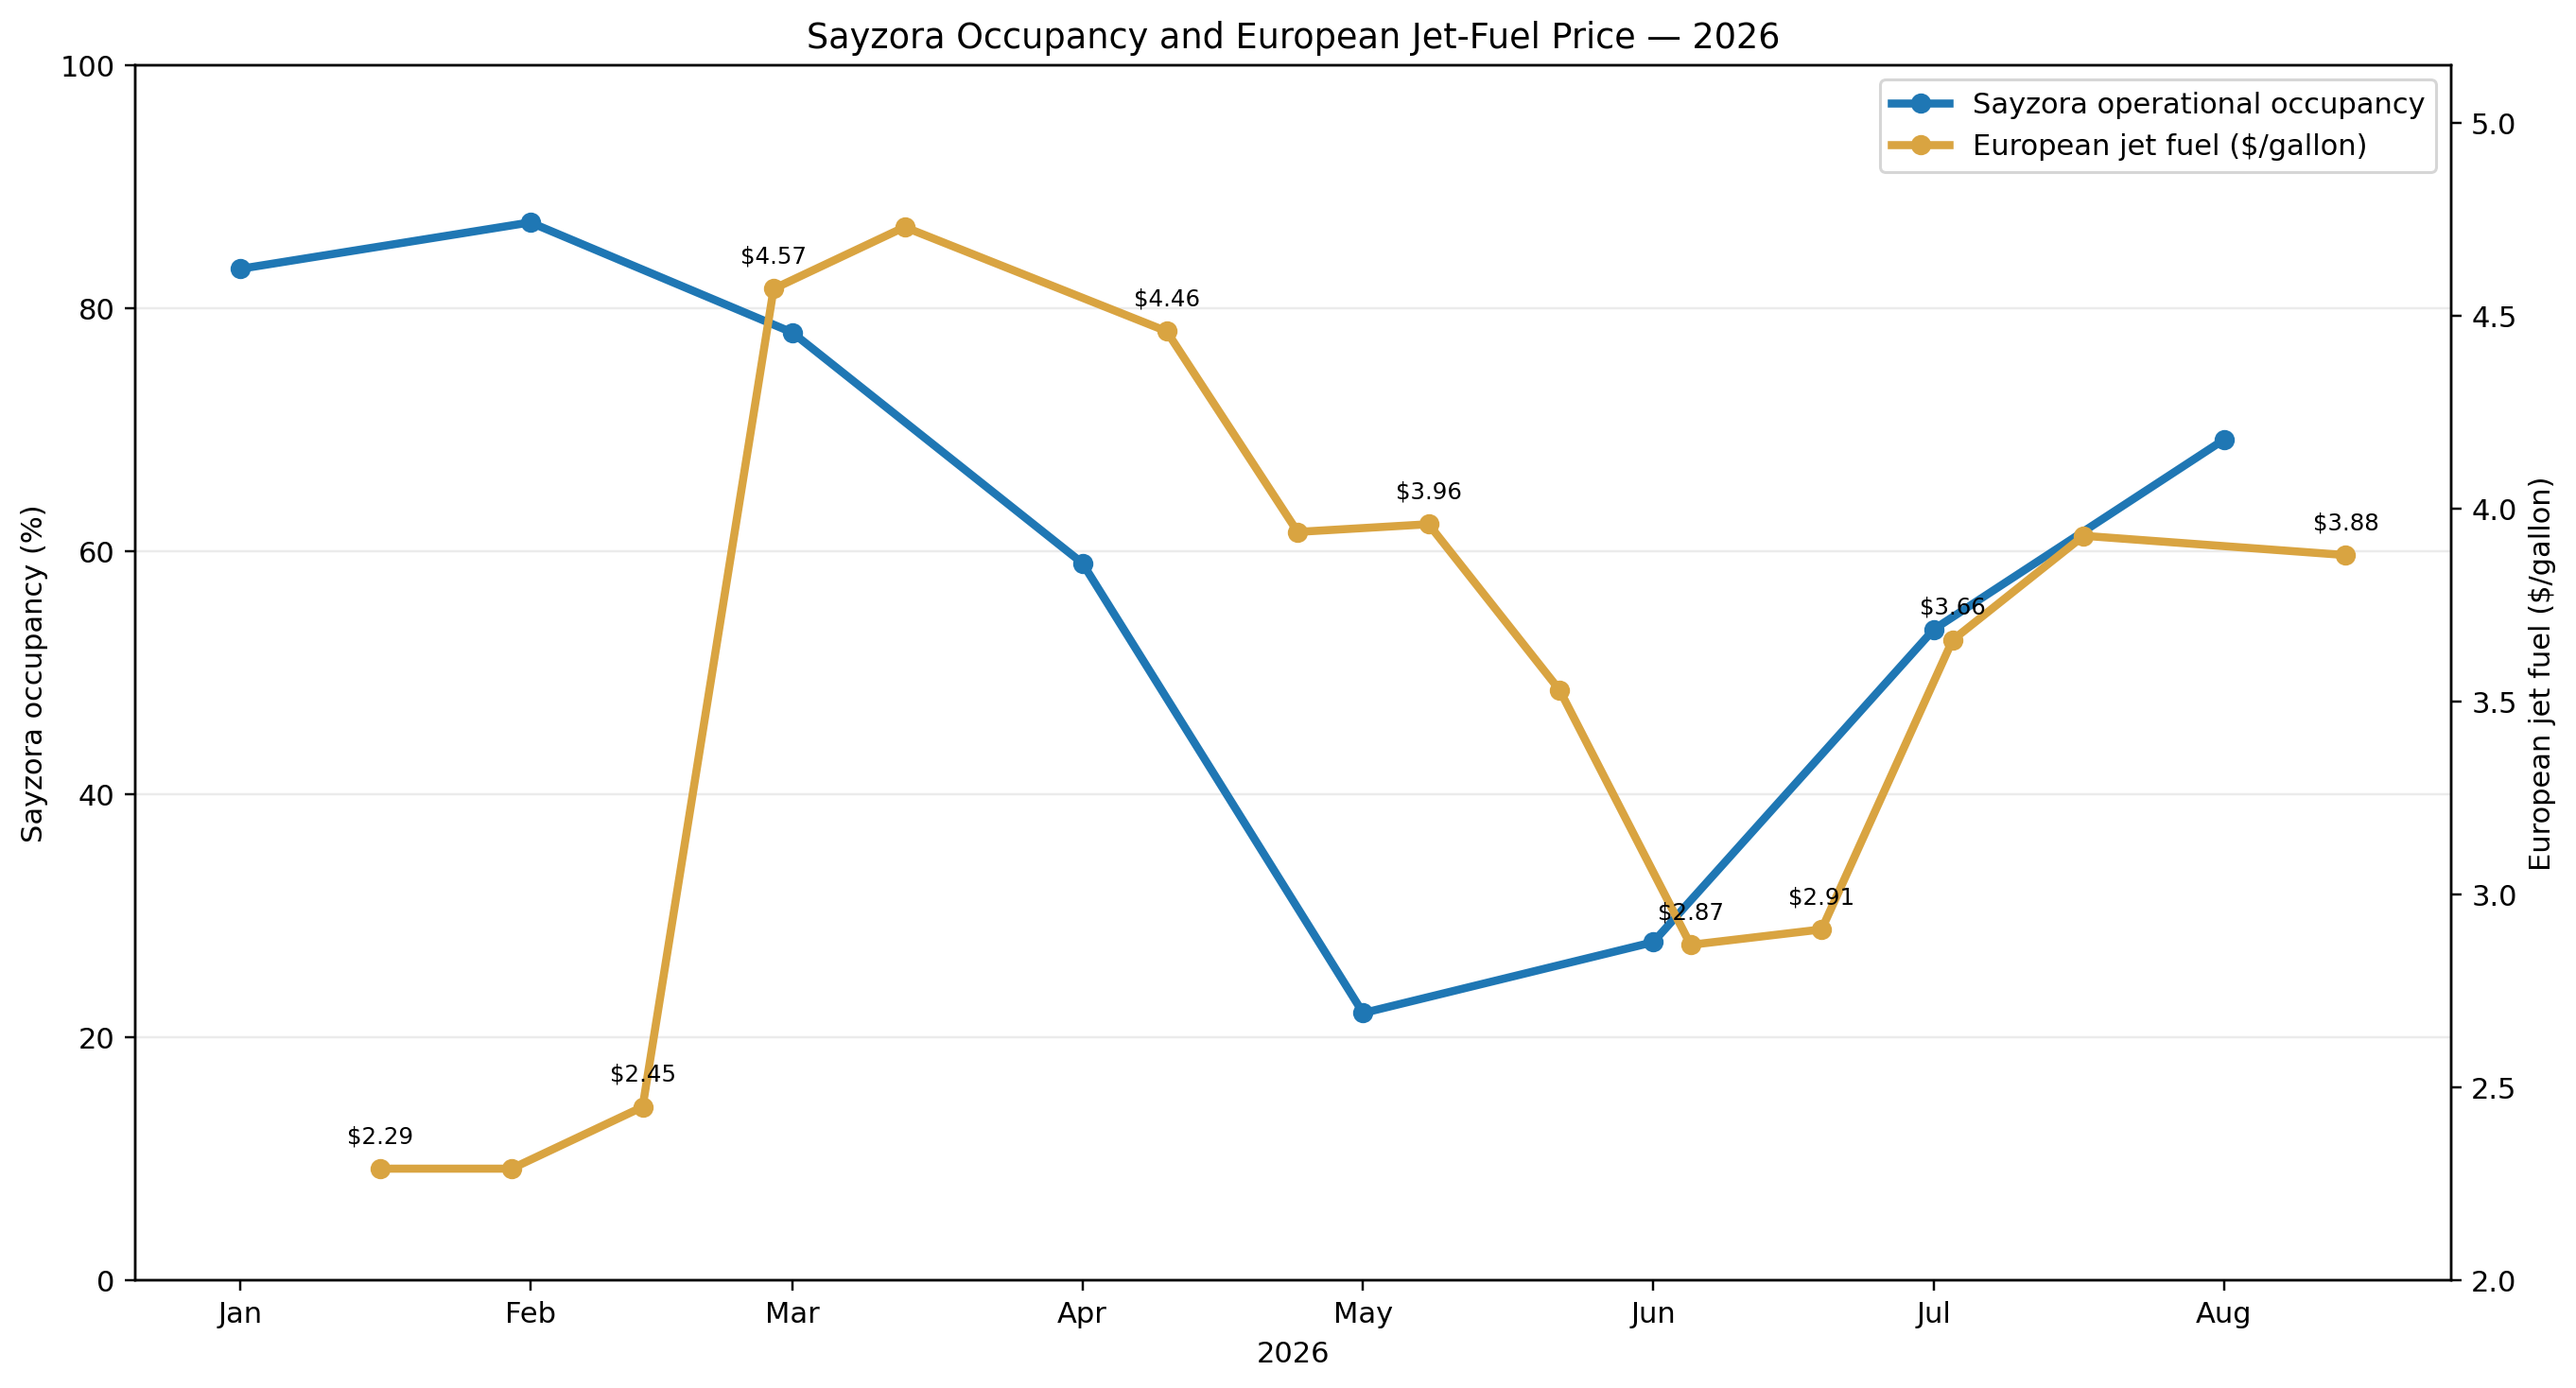
EUROCONTROL reported that European jet-fuel prices averaged $4.74 per gallon in April 2026, more than double the $2.26 per gallon level seen in January–February. European jet-fuel prices reached a record high in mid-March following supply disruptions linked to the closure of the Strait of Hormuz.
By early July, jet-fuel prices had fallen sharply from the early-April peak of approximately $5.01 per gallon to $2.91 per gallon. EUROCONTROL also reported that air-ticket prices, excluding inflation, were 1.7% lower during January–May 2026 than in the same period of 2025.
| Period | Tenerife South passengers | YoY change |
|---|---|---|
| April 2026 | 1,063,254 | −8.2% |
| June 2026 | 935,707 | −5.7% |
| July 2026 | 1,039,708 | −5.0% |
| August 2026 | 1,064,586 | −4.2% |
AENA reported 6.845 million passengers at Tenerife South in the first six months of 2026, 2.9% fewer than in the corresponding period of 2025. Tenerife South was also below the previous year in June, July and August.
5. Fuel-Supply Concerns and Airline Capacity
The aviation disruption was not limited to the price of fuel. During the spring, industry warnings also focused on fuel availability and the possible effect on airline schedules.
EUROCONTROL reported that European airlines were adapting capacity as the fuel-price shock affected operating economics. In late March, the average European jet-fuel price closed at $4.73 per gallon, approximately twice the level at the beginning of the year.
These conditions provide documented external context for the travel environment. They should not, however, be interpreted as proof that Europe actually ran out of jet fuel or that fuel prices alone determined Tenerife tourism demand.
6. What the Combined Data Suggests
The timing of the indicators is notable. Sayzora occupancy was above 2025 levels in January and February, moved below 2025 in March, and recorded its largest negative differences in April, May and June. This coincided with weaker Tenerife South passenger traffic and the March–April jet-fuel price shock.
The relationship is not deterministic. Airport traffic measures passenger movements, ISTAC measures a market-level reserved-home indicator, and Sayzora measures occupancy within a specific portfolio. In addition, the Easter calendar differed between 2025 and 2026, which affects monthly aviation comparisons.
7. Why the 2026 Pattern Changed by Summer
The later recovery is also informative. EUROCONTROL reported that European jet-fuel prices fell sharply from their early-April peak, reaching $2.91 per gallon on 3 July.
At the same time, Sayzora's year-on-year occupancy gap narrowed from −30.34 percentage points in June to −4.73 percentage points in July, and August 2026 moved 2.18 percentage points above August 2025.
This timing is compatible with an improvement in the external aviation environment, but it should again be treated as supporting context rather than proof of causation.
8. Methodology and Limitations
Sayzora / Hostaway: occupancy is calculated from real operational capacity. A property enters the capacity calculation only from the first month in which it records booked nights.
ISTAC: the reserved-home rate is a market indicator and is not directly interchangeable with Sayzora occupancy.
AENA: passenger traffic is used as an indicator of airport activity and travel demand, not as a direct measure of holiday-rental demand.
EUROCONTROL: fuel-price observations provide external aviation context. The chart uses the verified April monthly average and 3 July observation rather than inventing monthly values for periods for which we do not have a directly comparable source.
Seasonality: comparing the same months in 2025 and 2026 reduces normal seasonal effects, but calendar differences such as Easter mean that seasonality is not completely eliminated.
9. Conclusion
The 2026 Sayzora data shows a pronounced spring and early-summer weakening relative to 2025, followed by a recovery in July and August. The timing overlaps with a period of unusually high European jet-fuel prices, airline capacity adjustments and lower passenger traffic at Tenerife South.
Taken together, Sayzora portfolio data, ISTAC market indicators, AENA airport statistics and European aviation data provide a useful framework for understanding the 2026 performance. The evidence supports considering aviation conditions as one of several external factors affecting demand, while avoiding the unsupported conclusion that fuel prices alone caused the occupancy changes.
Data Sources
Sayzora Hospitality / Hostaway: portfolio occupancy and operational-capacity calculations for 2025 and 2026.
ISTAC / Observatorio Turístico de Canarias: Tenerife vacation-rental supply, reserved-home rate, ADR and average stay.
AENA: April 2026 Tenerife South traffic, January–June 2026 traffic, July 2026 traffic and August 2026 traffic.
EUROCONTROL: April 2026 European Aviation Overview and Week 27 European Aviation Overview.
Data & Market Analysis Team
Tenerife, Canary Islands