1. Executive Summary
The first eight months of 2026 show a mixed performance pattern across the Sayzora Hospitality portfolio. The year started with strong occupancy in January and February, followed by a clear slowdown from March through June. July and August then brought a meaningful recovery in occupancy.
At the same time, average nightly pricing was generally lower than in the stronger winter months. Longer stays partly offset the lower nightly rates: by July and August, the portfolio's implied average stay was above eight nights.
Official ISTAC market indicators provide useful context. Tenerife's market also experienced changes in average daily price and length of stay during the period, while the number of vacation homes available on the market remained materially below the level seen in 2025.
2. January–June 2026: A Strong Start Followed by a Softer Spring
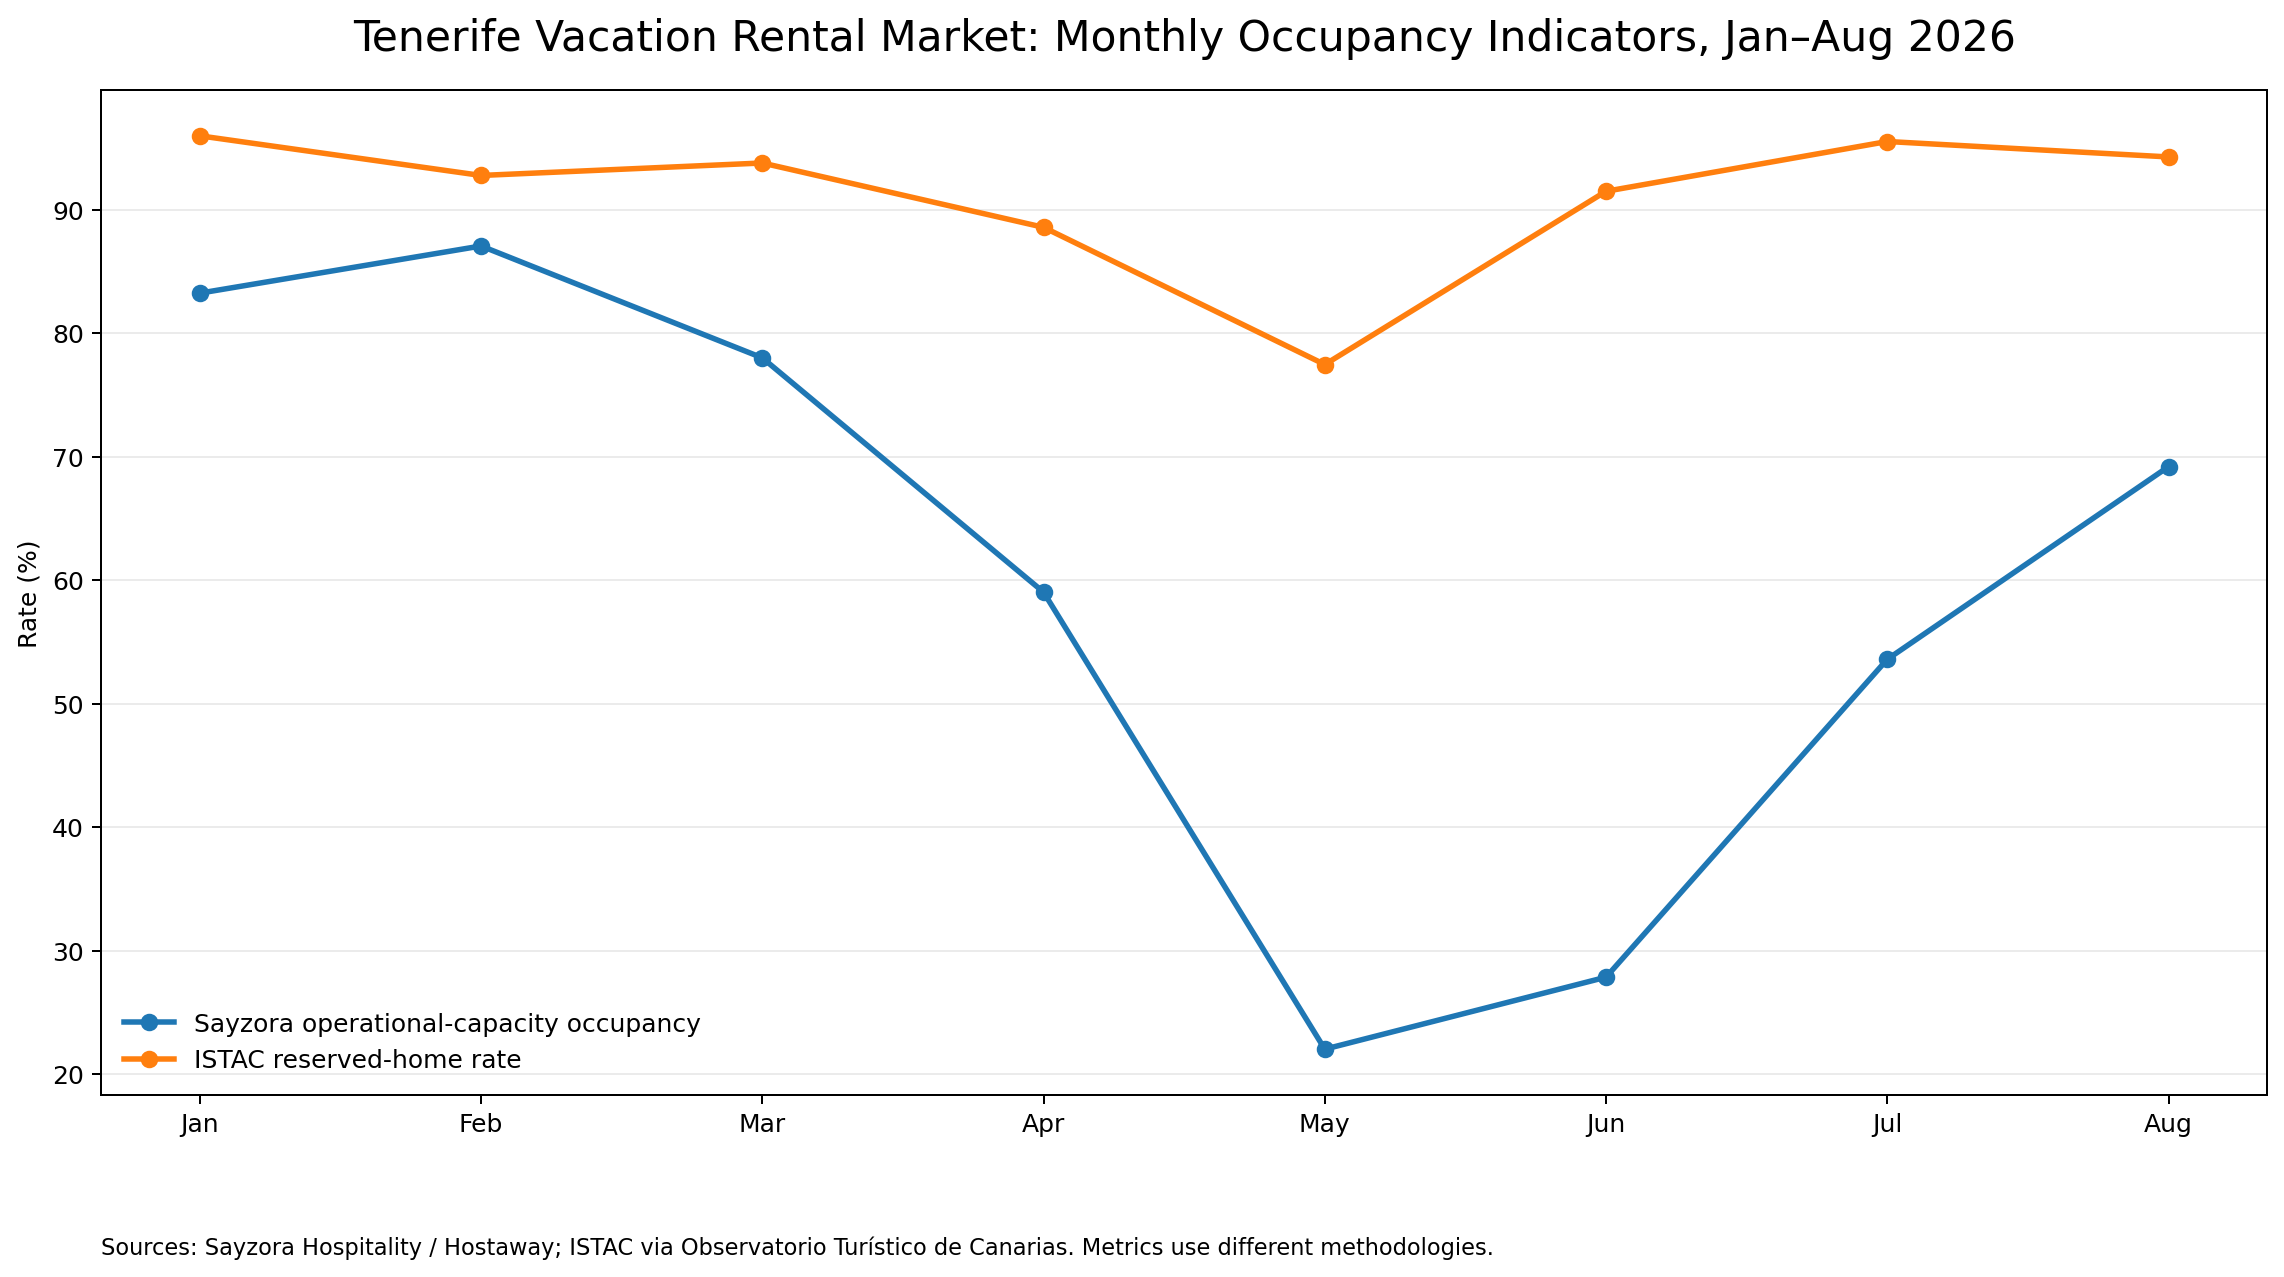
Using an operational-capacity methodology based on the first month in which a listing recorded booked nights, Sayzora's occupancy was particularly strong in January and February. It then declined from March through June.
| Month | Sayzora occupancy | YoY difference |
|---|---|---|
| January | 83.23% | +8.39 pp |
| February | 87.05% | +2.05 pp |
| March | 77.99% | −4.59 pp |
| April | 59.02% | −16.65 pp |
| May | 22.01% | −13.77 pp |
| June | 27.84% | −30.34 pp |
| July | 53.58% | −4.73 pp |
| August | 69.18% | +2.18 pp |
Across the first half of 2026, the recalculated operational-capacity occupancy was 58.49%, compared with 67.72% in the corresponding 2025 period, a difference of −9.23 percentage points.
3. Monthly Occupancy Evolution
The monthly pattern is important. January and February were the strongest months for Sayzora occupancy under the operational-capacity methodology. The largest gap versus the previous year appeared in June, before occupancy improved in July and August.
This pattern suggests that the portfolio's 2026 performance was not uniform throughout the year. A year-to-date average can therefore hide important seasonal changes.
4. Sayzora vs the Tenerife Market: What Does ISTAC Show?
The official ISTAC data provides a market benchmark for Tenerife. Its tasa de vivienda reservada is a market-level indicator and should not be treated as the direct equivalent of Sayzora's booked-nights occupancy.
Nevertheless, the two series are useful when read together. ISTAC's market indicator remained high throughout most of the first eight months, while Sayzora's operational occupancy showed a much wider seasonal range.
5. Pricing: Sayzora and the Market Moved in the Same Direction
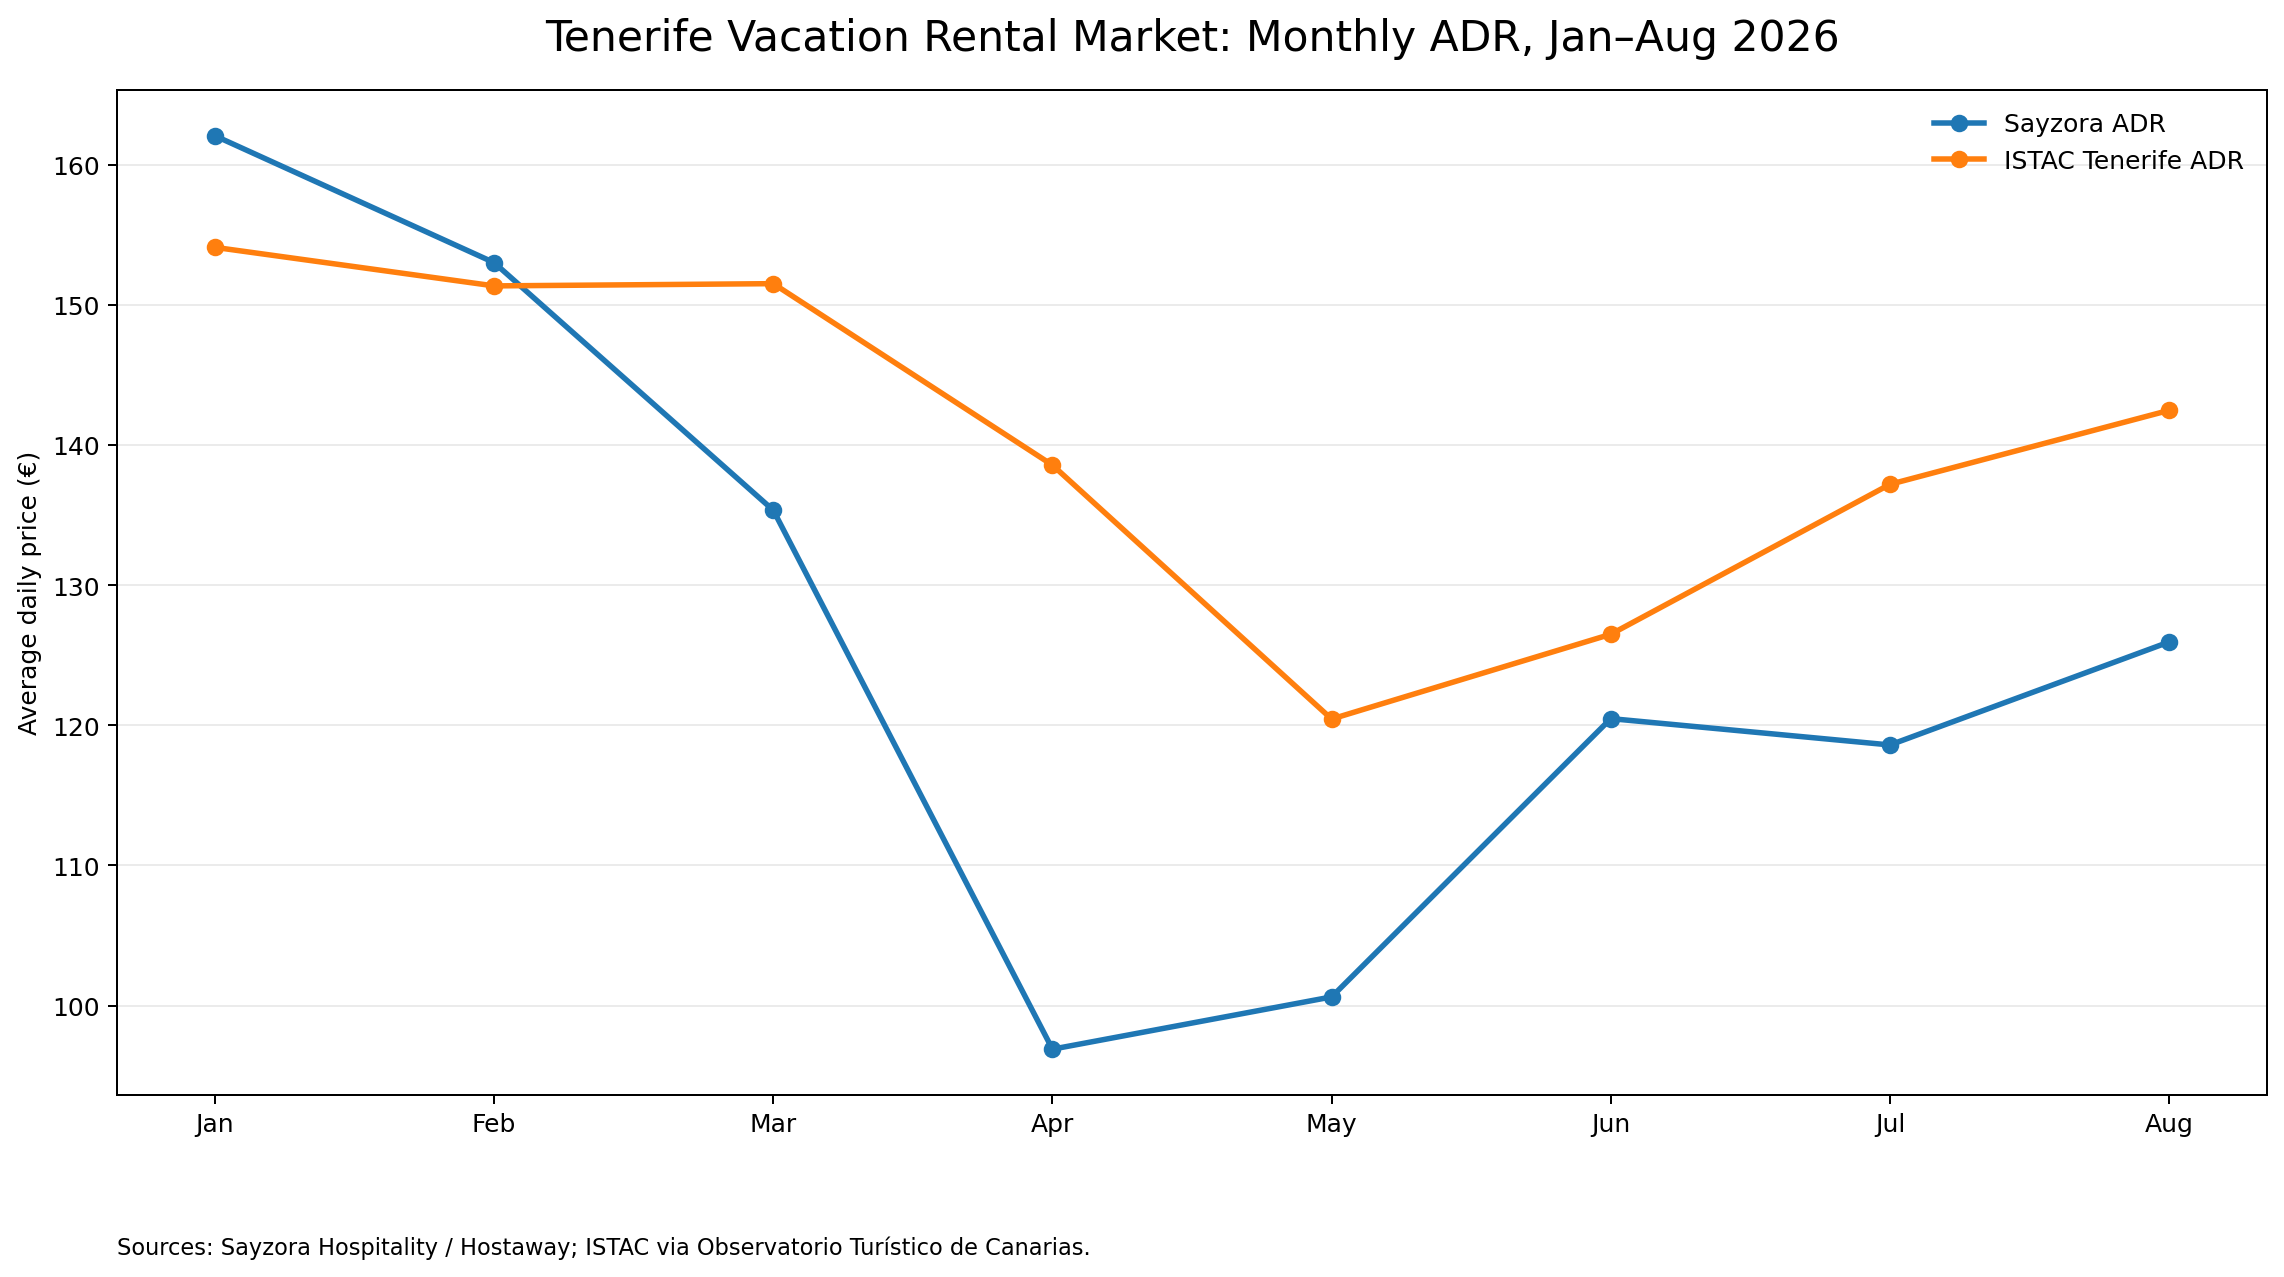
Sayzora's ADR declined from €162.07 in January to €96.89 in April, before recovering to €125.95 in August. The official Tenerife ADR followed a broadly similar seasonal direction, although the market ADR remained above the Sayzora portfolio ADR from March through August.
| Month | Sayzora ADR | ISTAC Tenerife ADR |
|---|---|---|
| January | €162.07 | €154.11 |
| February | €153.02 | €151.36 |
| March | €135.35 | €151.52 |
| April | €96.89 | €138.57 |
| May | €100.62 | €120.45 |
| June | €120.48 | €126.50 |
| July | €118.60 | €137.20 |
| August | €125.95 | €142.48 |
6. Longer Stays: Another Common Pattern
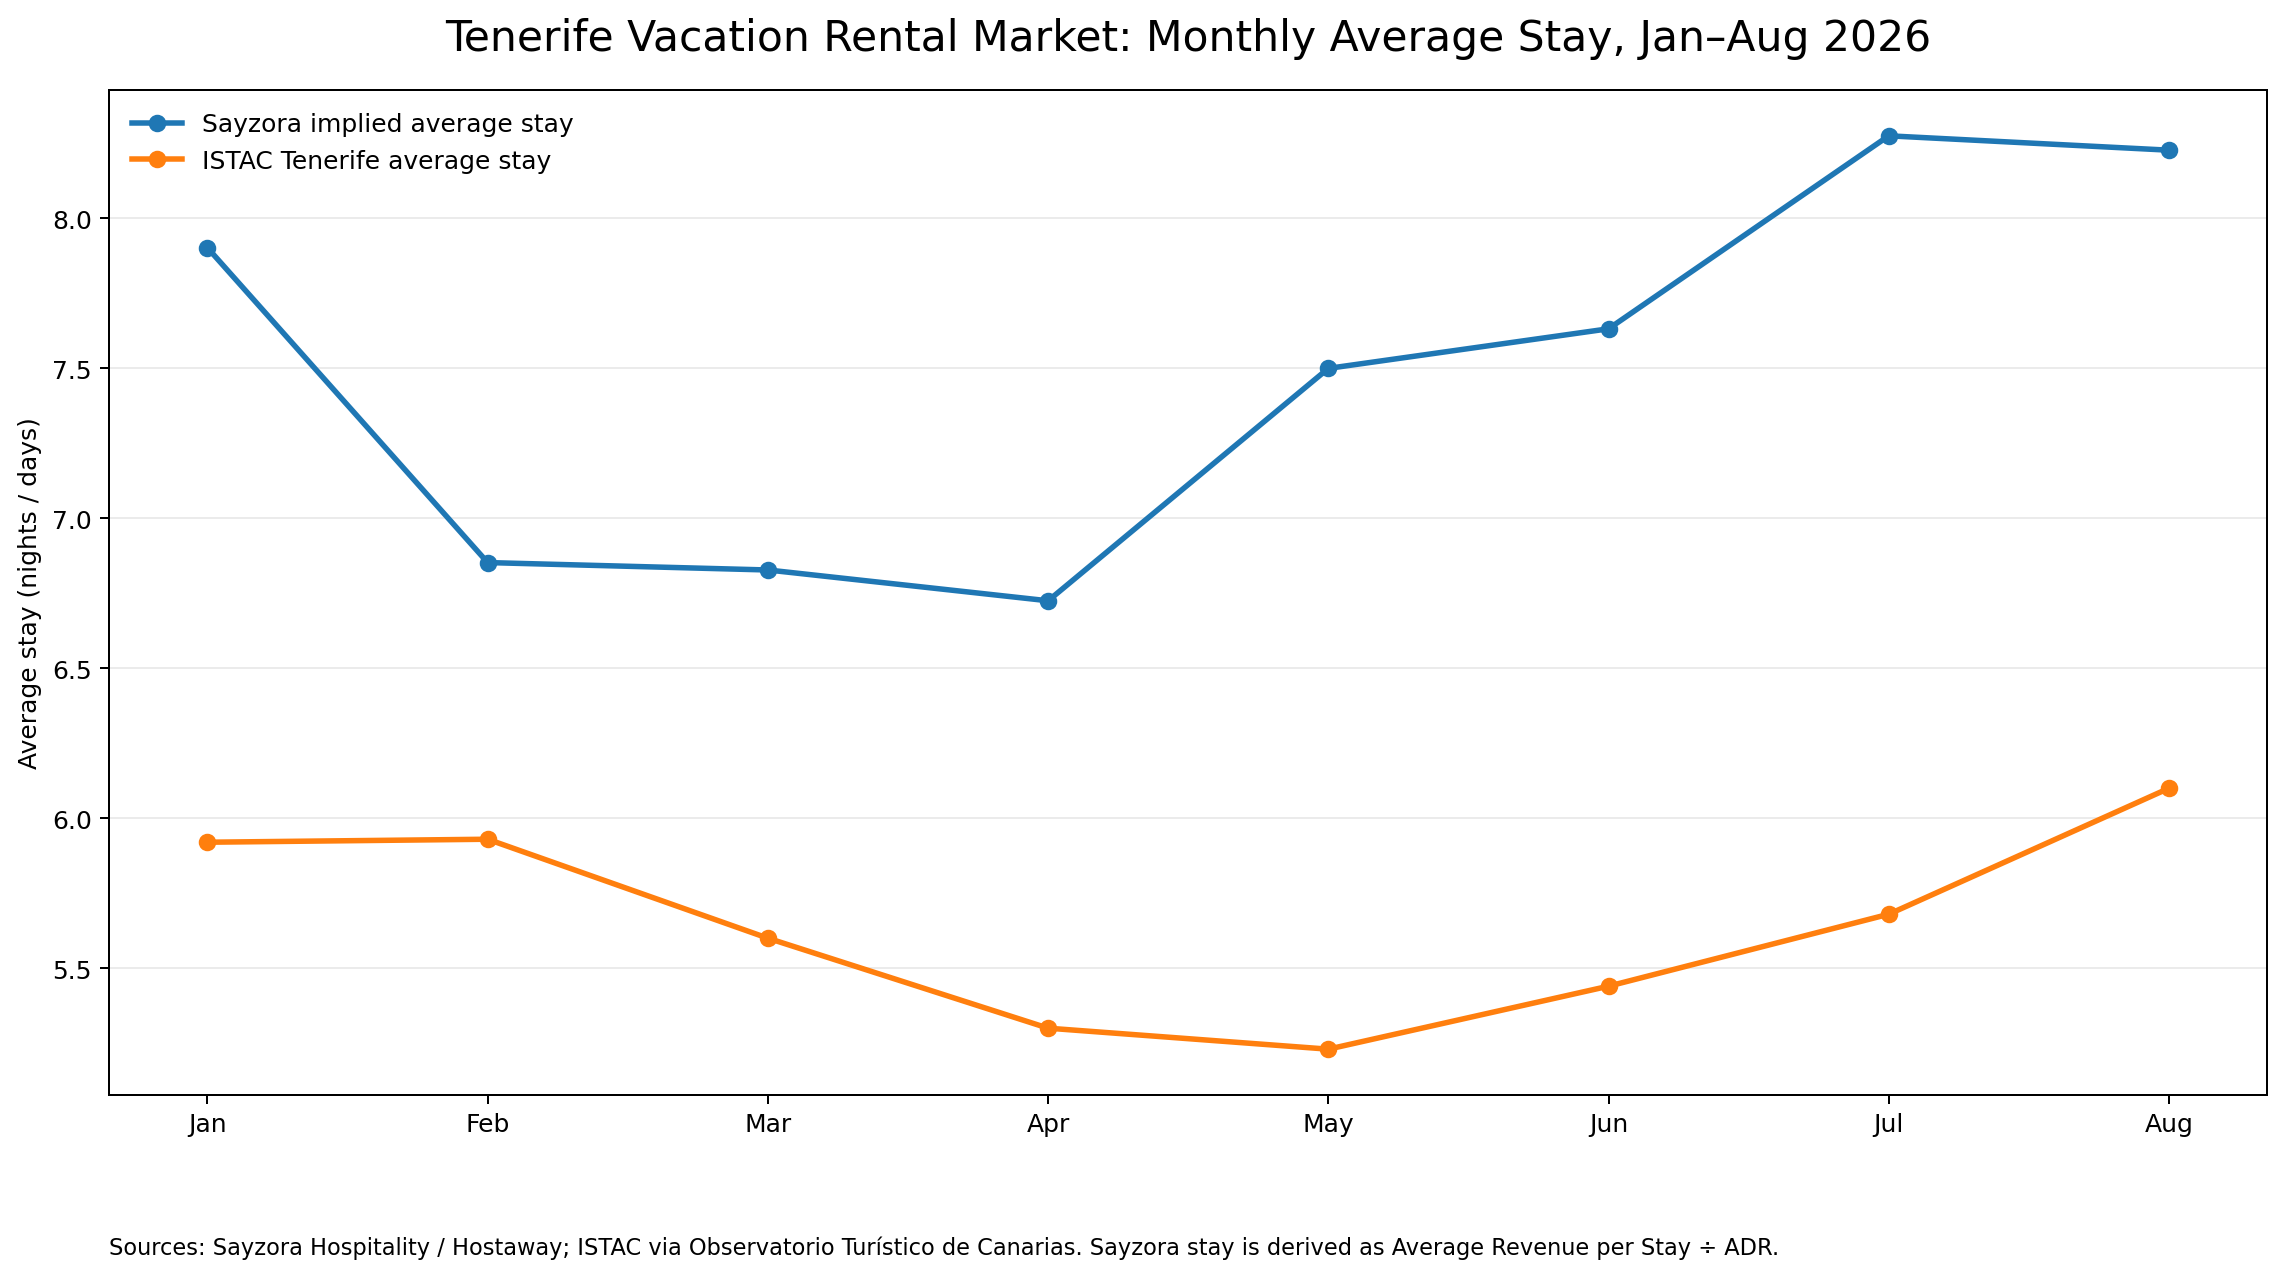
The Sayzora portfolio's implied average stay increased during the summer. It reached approximately 8.28 nights in July and 8.23 nights in August.
Sayzora's implied stay is calculated as Average Revenue per Stay ÷ Average Nightly Price. It is therefore an analytical indicator derived from Hostaway data rather than a directly reported average-stay field.
| Month | Sayzora implied stay | ISTAC Tenerife average stay |
|---|---|---|
| January | 7.90 nights | 5.92 days |
| February | 6.85 nights | 5.93 days |
| March | 6.83 nights | 5.60 days |
| April | 6.73 nights | 5.30 days |
| May | 7.50 nights | 5.23 days |
| June | 7.63 nights | 5.44 days |
| July | 8.28 nights | 5.68 days |
| August | 8.23 nights | 6.10 days |
The difference in the two series should not be interpreted as a direct performance ranking. The populations and methodologies are different. The useful observation is that longer stays became an increasingly visible characteristic of the Sayzora portfolio during the summer months.
7. August 2026: Sayzora and Tenerife
August provides a useful snapshot of the late-summer recovery. Sayzora recorded 69.18% operational occupancy and an ADR of €125.95, with an implied average stay of 8.23 nights.
For Tenerife, ISTAC reported a reserved-home rate of 94.26%, an ADR of €142.48 and an average stay of 6.10 days. Again, the occupancy indicators are not directly equivalent, but the pricing and stay-duration figures provide useful market context.
8. Tenerife Market Supply
The official market supply indicator also changed significantly during 2026. Available vacation homes in Tenerife fell through the first part of the year before recovering somewhat in July and August.
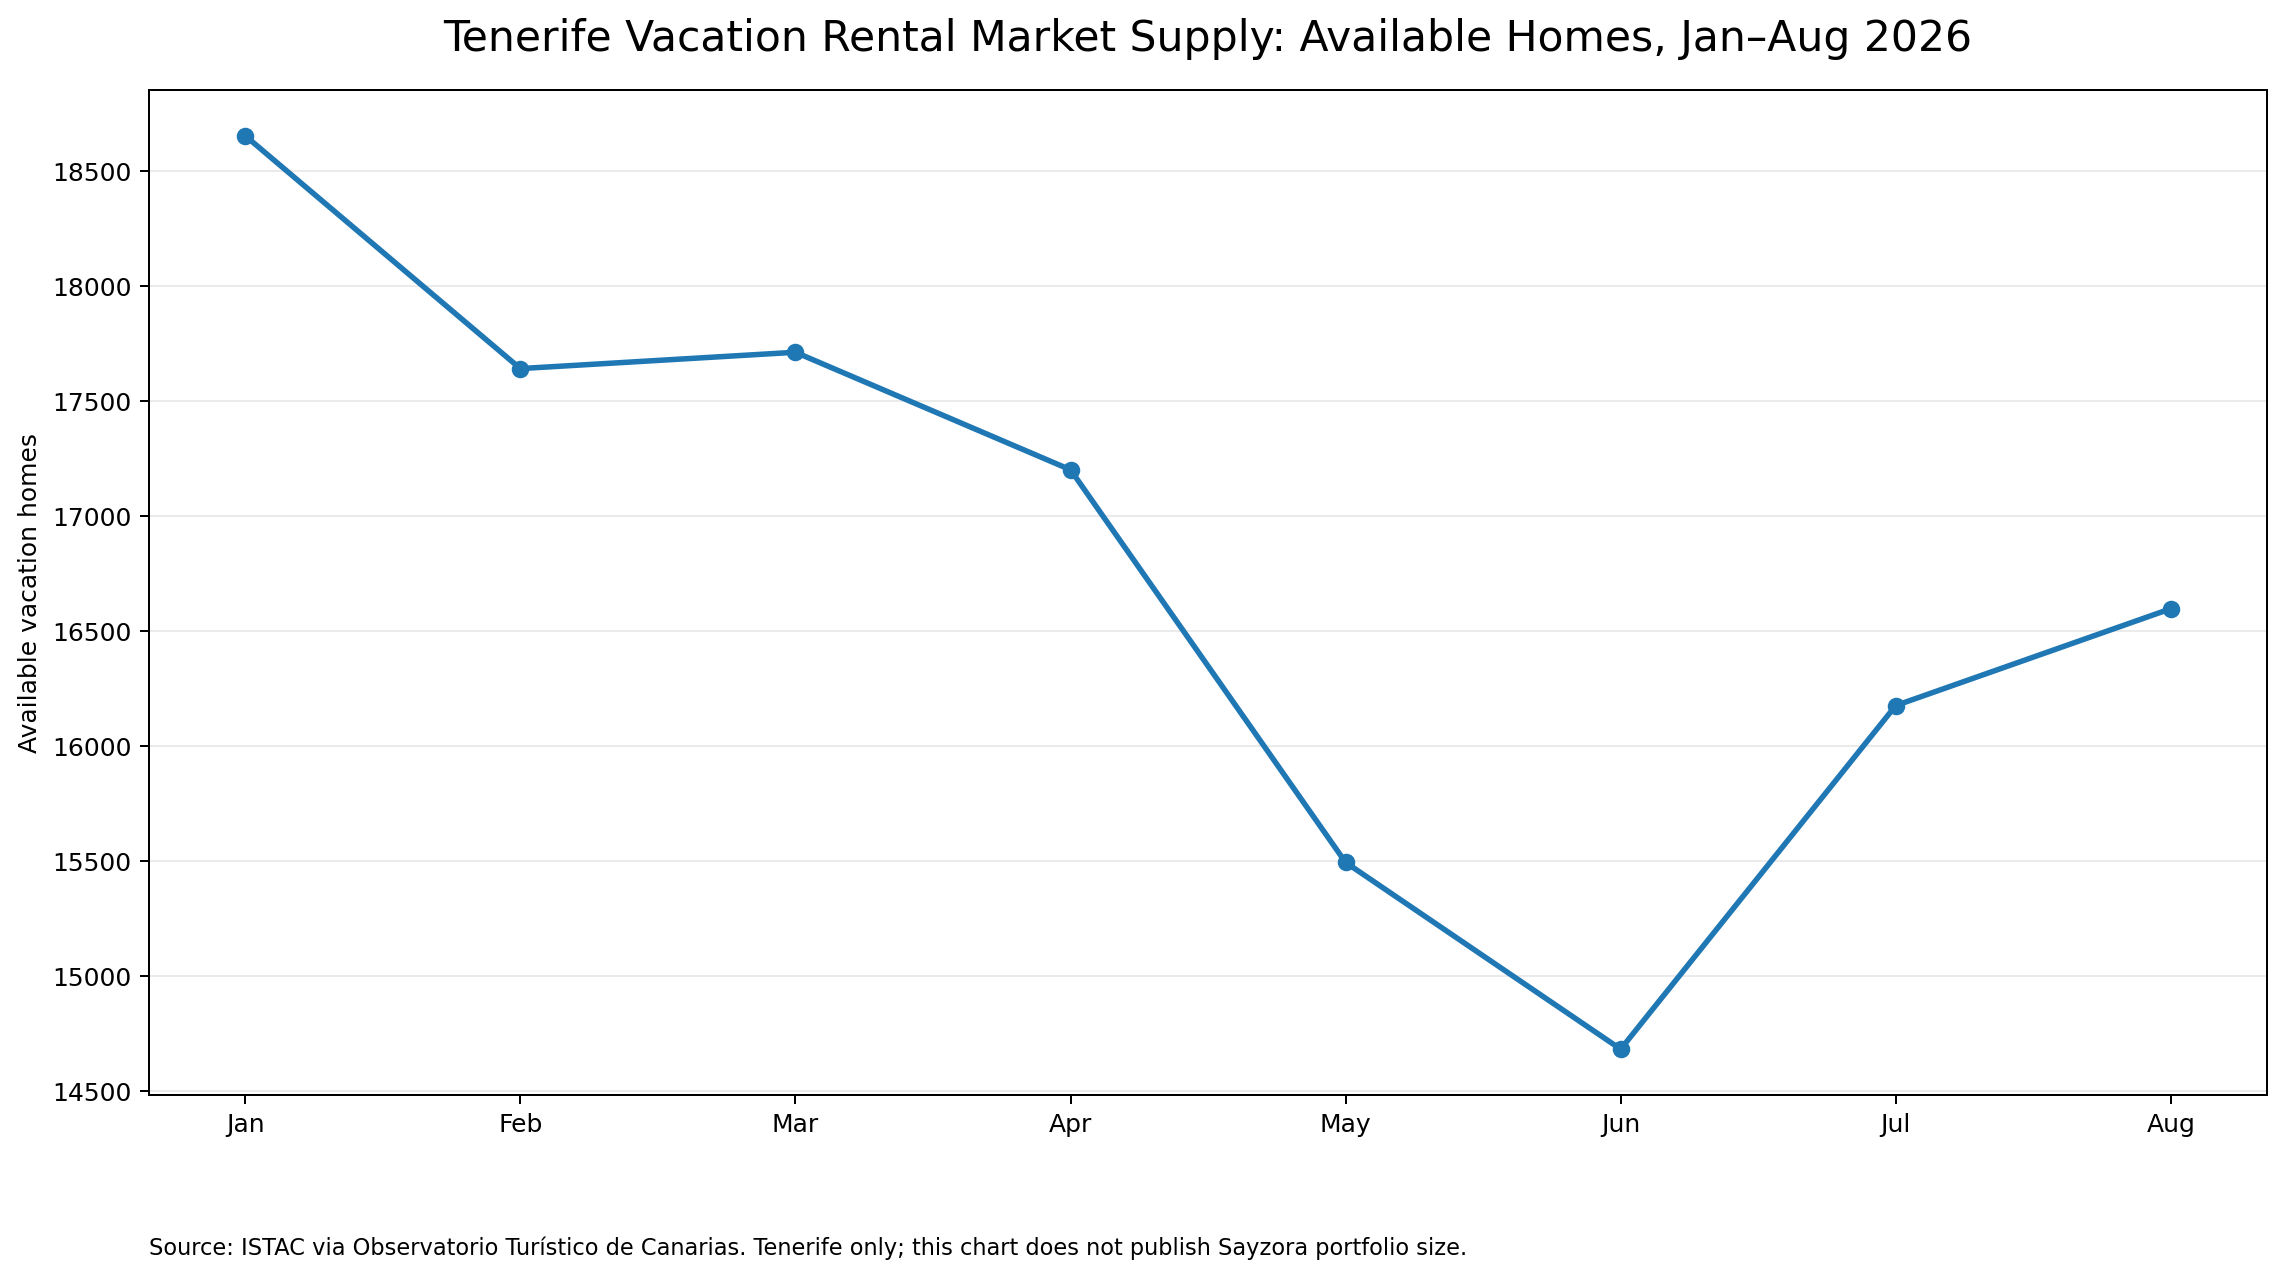
The August 2026 market had 16,597 available vacation homes, compared with 19,422 in August 2025, a reduction of approximately 14.6% year on year.
9. Portfolio Performance vs Market Conditions
The data shows why portfolio performance and market conditions should be analysed together.
- Occupancy: Sayzora experienced a substantial seasonal swing, with a strong winter followed by a softer spring and a recovery in July and August.
- Pricing: Sayzora ADR was below the Tenerife market benchmark during most of March–August, while the direction of movement was broadly similar.
- Length of stay: Sayzora's implied average stay was consistently above the ISTAC Tenerife average-stay indicator during the period, particularly in July and August.
- Supply: Tenerife's available vacation-home supply was lower than in the previous year, including a 14.6% year-on-year reduction in August.
10. Why Both Datasets Matter
Market data explains the environment in which vacation-rental businesses operate. Portfolio data explains what happened within a specific managed inventory.
Neither dataset should be used alone to explain performance. A market-wide indicator cannot show how an individual portfolio responded to pricing, distribution, listing quality, booking windows, property mix or operational decisions. Conversely, portfolio data cannot by itself establish whether a change was specific to the portfolio or part of a broader Tenerife market movement.
11. Conclusion
The January–August 2026 data shows a Tenerife vacation-rental environment characterised by strong seasonal variation, changing prices, longer stays and a reduced market supply compared with the previous year.
For Sayzora, the most visible pattern was the contrast between a strong January–February period, a softer March–June period and a recovery in July–August. At the same time, the portfolio's implied average stay increased, reaching more than eight nights in July and August.
The most useful way to read the data is therefore not through a single headline number, but through the interaction between occupancy, ADR, length of stay and the wider Tenerife market indicators.
Data Sources and Methodology
Sayzora Hospitality / Hostaway: occupancy, ADR and Average Revenue per Stay were taken from Hostaway reporting for the relevant monthly periods. Sayzora operational occupancy uses an internal methodology in which a property enters the operational-capacity calculation in the first month in which it records booked nights.
Implied average stay: calculated as Average Revenue per Stay ÷ Average Nightly Price (ADR).
ISTAC / Observatorio Turístico de Canarias: Tenerife market indicators including ADR, average stay, reserved-home rate and available vacation homes.
Important: ISTAC's reserved-home rate is not identical to Hostaway occupancy. The two indicators are presented together only as contextual market measures. Average-stay figures also use different source populations and methodologies.
Data & Market Analysis Team
Tenerife, Canary Islands